Time-Varying DAGs with NOTEARS
The gene expression of cells undergoes a large amount of transformation that can be linked to processes such as the development of progenitor stem cells or the transformation of healthy tissue into cancerous tumors. However, linking the changes of a single cell to other important dynamic processes occurring in surrounding cells/tissues is a non-trivial task. Cell development is oftentimes not synchronized within a single sample or tissue, introducing the need for flexibility in measuring temporal correlations.
In order to solve these issues, time-based inference methods using graphical models that seek to account for the biological similarities among certain cells in addition their temporal dependencies have been introduced. The goal of this project is to optimize the Non-combinatorial Optimization via Trace Exponential and Augmented lagRangian for Structure learning (NOTEARS) framework (Zheng et al., 2018) for learning time-varying DAGs.
We summarize our contributions as followed:
- We adapt the NOTEARS for the estimation of the graphical models using time-varying data.
- We introduce a theoretical modification to the existing DYNOTEARS framework to impose regularization on graph nodes that are close together in the time series.
- We compare several graph aggregation techniques to combine independent time series graphs into a static ground truth graph.
- We explore different time regularization techniques for combining independent, static graphs into dynamic graphs.
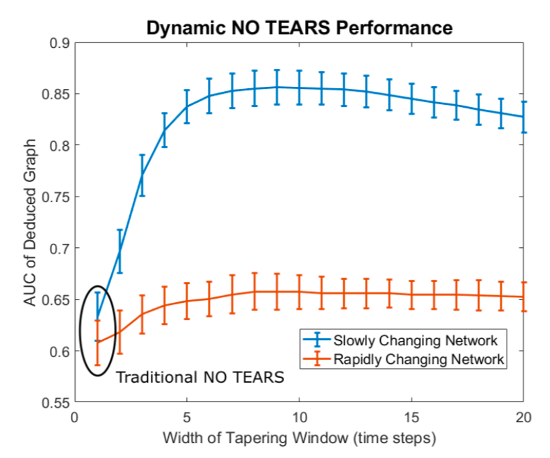
Figure: Accuracy of Temporally Regularized NOTEARS implementation. We implemented a dynamic Gaussian Bayesian network whose structure changed over time and assessed our algorithm’s ability to deduce the correct network structure over each time point. We utilized two networks: one “slowly-changing” network where each edge had a 10% of changing each time step and one faster changing network where each edge had a 50% chance of changing. The x-axis shows how “temporally smooth” our hyperparameterization forces the deduced graphs to be. The far left points represent no temporal smoothness penalization which is identical to using the original NO TEARS implementation on each time point independently.